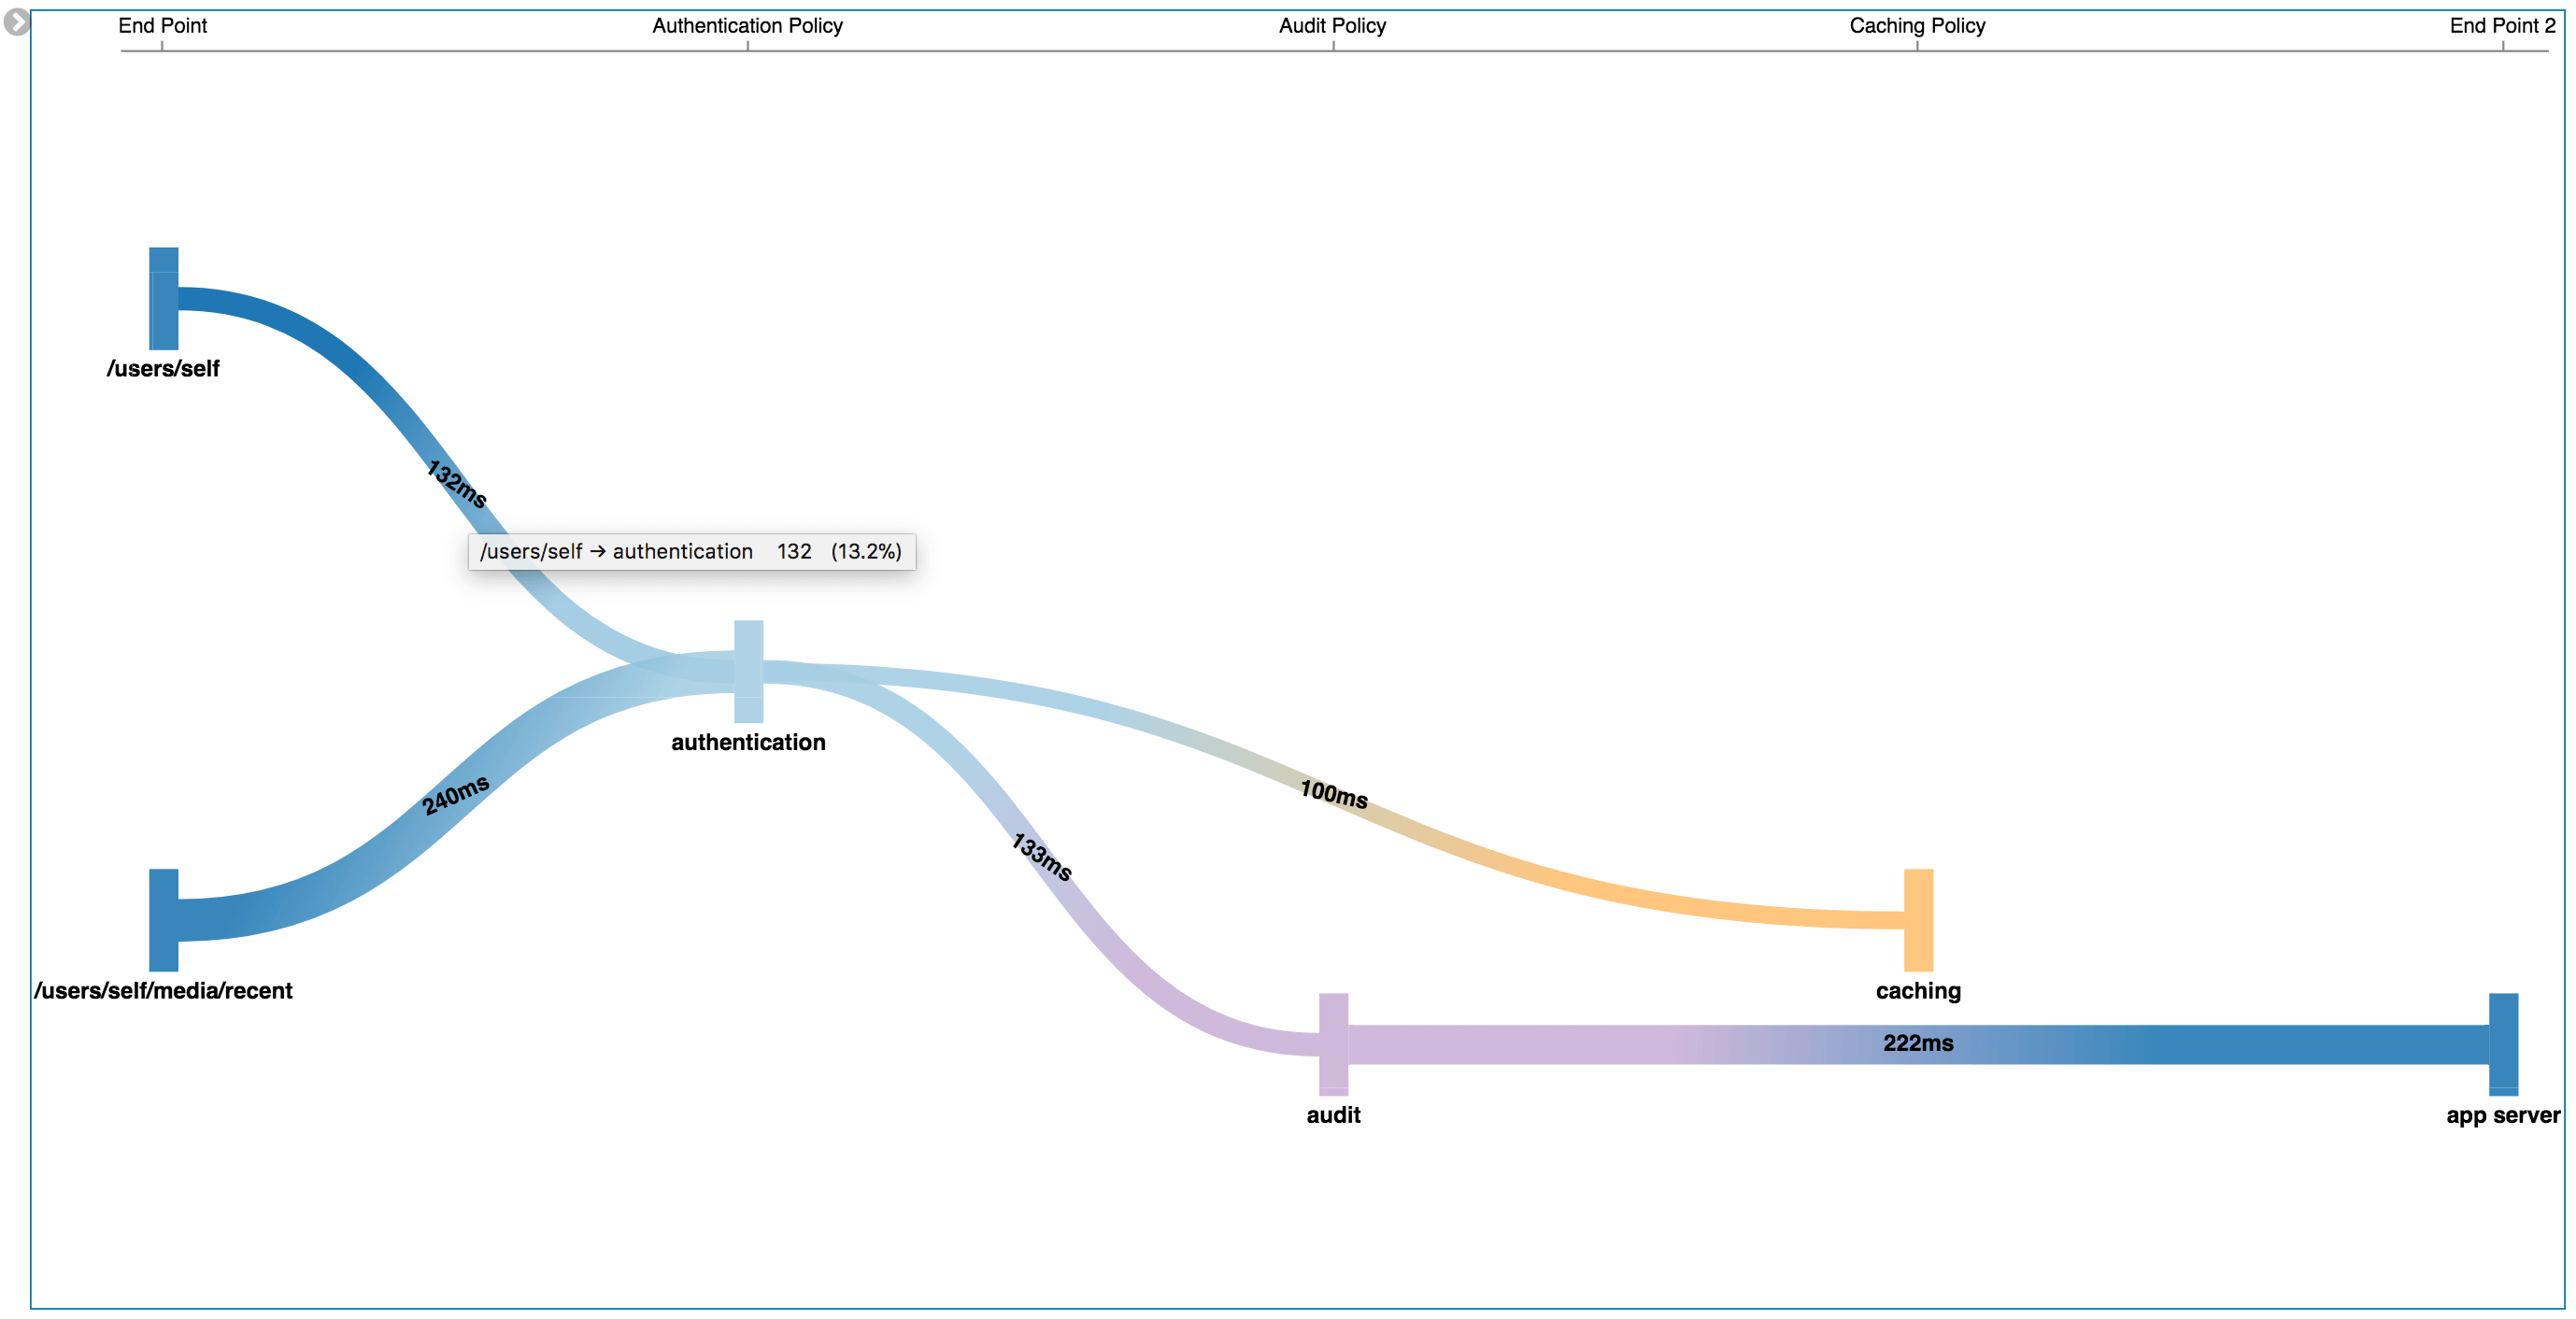
Visualisation of application traffic. The component along the path are shown as nodes and links between nodes represent the flow of the traffic.
Visualisation of application traffic. The component along the path are shown as nodes and links between nodes represent the flow of the traffic.